
PrometheusCORE
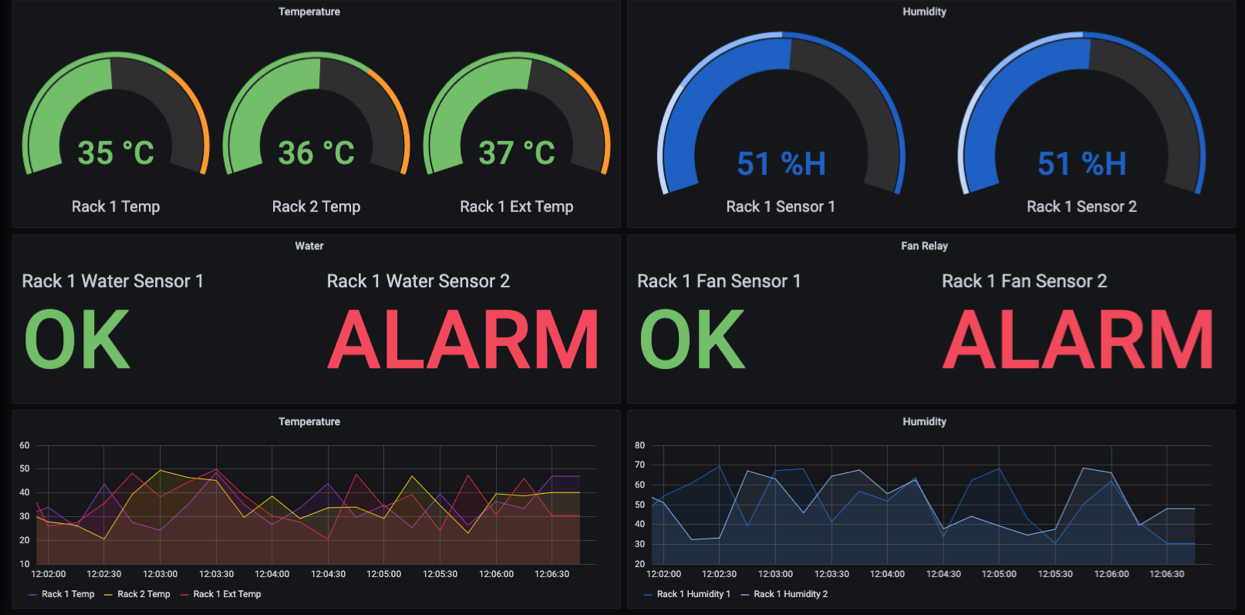
The central monitoring and trend-management platform. It brings distributed sites, equipment status, alerts and historical data into a single browser-based view — deployable on-premises or in the cloud.
Power, environment and infrastructure monitoring
Prometheus brings equipment health, environmental conditions and critical alerts into one clear monitoring platform — so teams can act earlier and operate with confidence.
The problem
Critical sites accumulate equipment from many vendors — power systems, cooling, sensors, security — each with its own console and its own alarms. The result is scattered information, slow diagnosis, and faults that surface only after they matter.
Solutions
The central monitoring and trend-management platform. It brings distributed sites, equipment status, alerts and historical data into a single browser-based view — deployable on-premises or in the cloud.
Edge data acquisition. It connects sites, equipment and sensors to the central platform, and keeps collecting locally through network interruptions — no gaps in your record. As the middle layer, it integrates intrusion detection, battery management and other edge equipment into the same platform.
Customisable operational views with real-time and historical trends. Alarm grouping and throttled notifications through configured channels such as email, SMS and WhatsApp.
Temperature, humidity, water leakage, dry contacts, power systems and equipment status — with support for compatible third-party equipment.
How it works
Power systems, environmental sensors, dry contacts and compatible third-party equipment at each site.
PrometheusSATELLITE acquires readings locally and forwards them to the platform — continuing through network interruptions.
PrometheusCORE turns the data into live status, historical trends and prioritised alerts in the browser.
AI & intelligence
Monitoring produces more data than any team can watch. PrometheusCORE applies analytics and AI-assisted trend modelling to the signals it already collects, and PrometheusSATELLITE brings that intelligence to the edge, so patterns surface before they become failures.
Edge integrations
PrometheusSATELLITE speaks to the equipment you already own. As the middle layer between site hardware and the platform, it turns each device’s own protocol into signals your team can see, trend and alert on.
Field-proven
Deployed in production today: PrometheusSATELLITE connects to commercial intrusion detection panels and streams arm and disarm states, door and zone activity, and alarm events into live dashboards, beside power and environment readings, across a whole fleet of sites.
Capabilities
Who it is for
Base stations, exchanges and remote cabinets.
Server rooms, plant rooms and protected spaces.
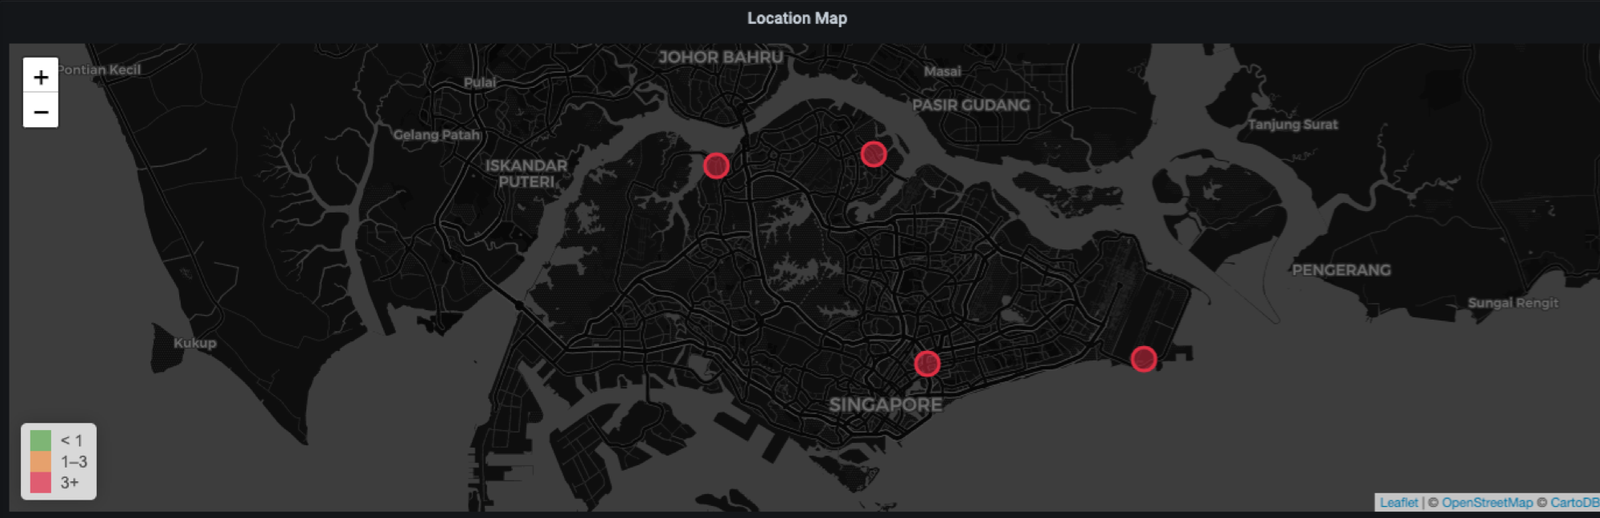
Estates of equipment across many locations.
Anyone responsible for conditions and continuity.
About
Prometheus Communications is a Singapore-based engineering company focused on making complex infrastructure easier to monitor, understand and manage. We combine adaptable edge collection with centralized visualization to fit real operational environments.
Operating since 2019.
Contact
Tell us about your sites, your equipment and what you need visibility over. We will come back with a practical way to monitor it.